FFT-based chord recognition from raw audio using a modular Rust signal processing pipeline.
- Implemented end-to-end chord detection using FFT/STFT, peak filtering, pitch class quantisation, and template matching.
- Built a Rust chord-matching engine with confidence metrics and extendable chord templates.
- Developed batch-processing tools that generate CSV logs, SVG chord diagrams, and Markdown diagnostics.
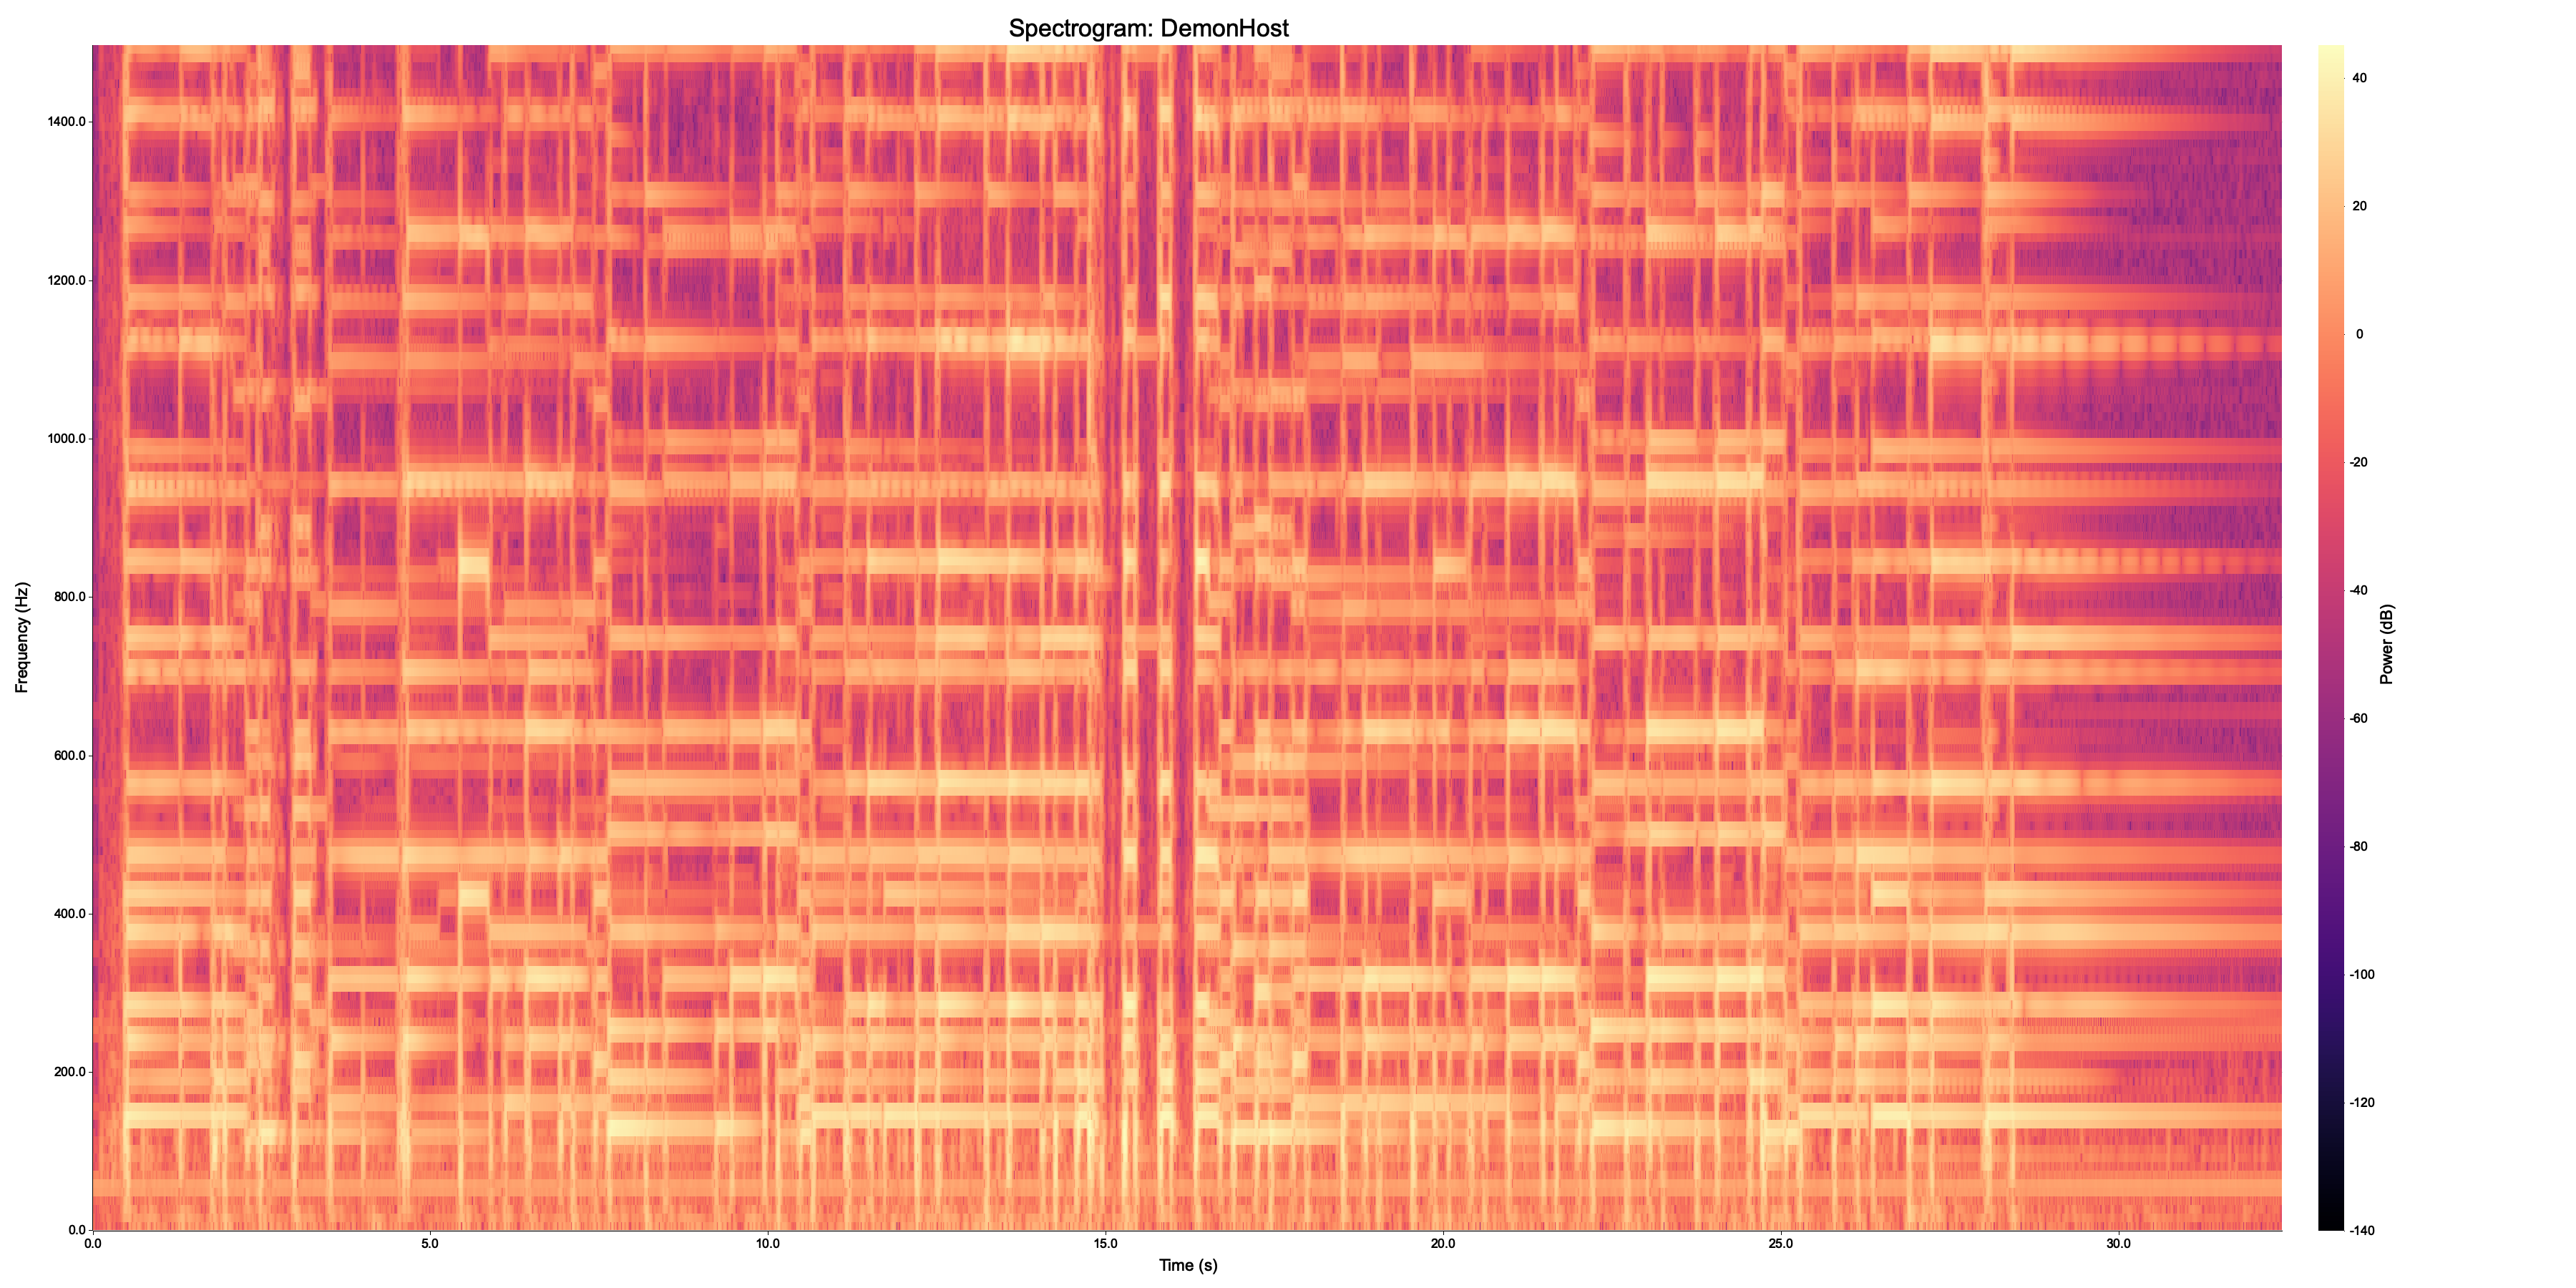
- Designed an STFT-based spectrogram generator with tunable windowing and dB scaling.
- Documented the full DSP and music theory pipeline for reproducibility and future research use.
Rust
Signal Processing
FFT / STFT
Audio Analysis
Music Information Retrieval
Data Pipeline Design